Roger Harris/Science Photo Library/Getty Images

STANDARDS

Common Core: RH.6-8.1, RH.6-8.2, RH.6-8.4, RH.6-8.7, WHST.6-8.4, RI.6-8.1, RI.6-8.2, RI.6-8.4, RI.6-8.7, W.6-8.4, SL.6-8.1

NCSS: Time, Continuity, and Change • People, Places, and Environments • Global Connections

GEO QUEST

Population Density

Predicting the World Population

Experts expect the global population will peak by the end of the century—then stop growing for the first time in modern history.  

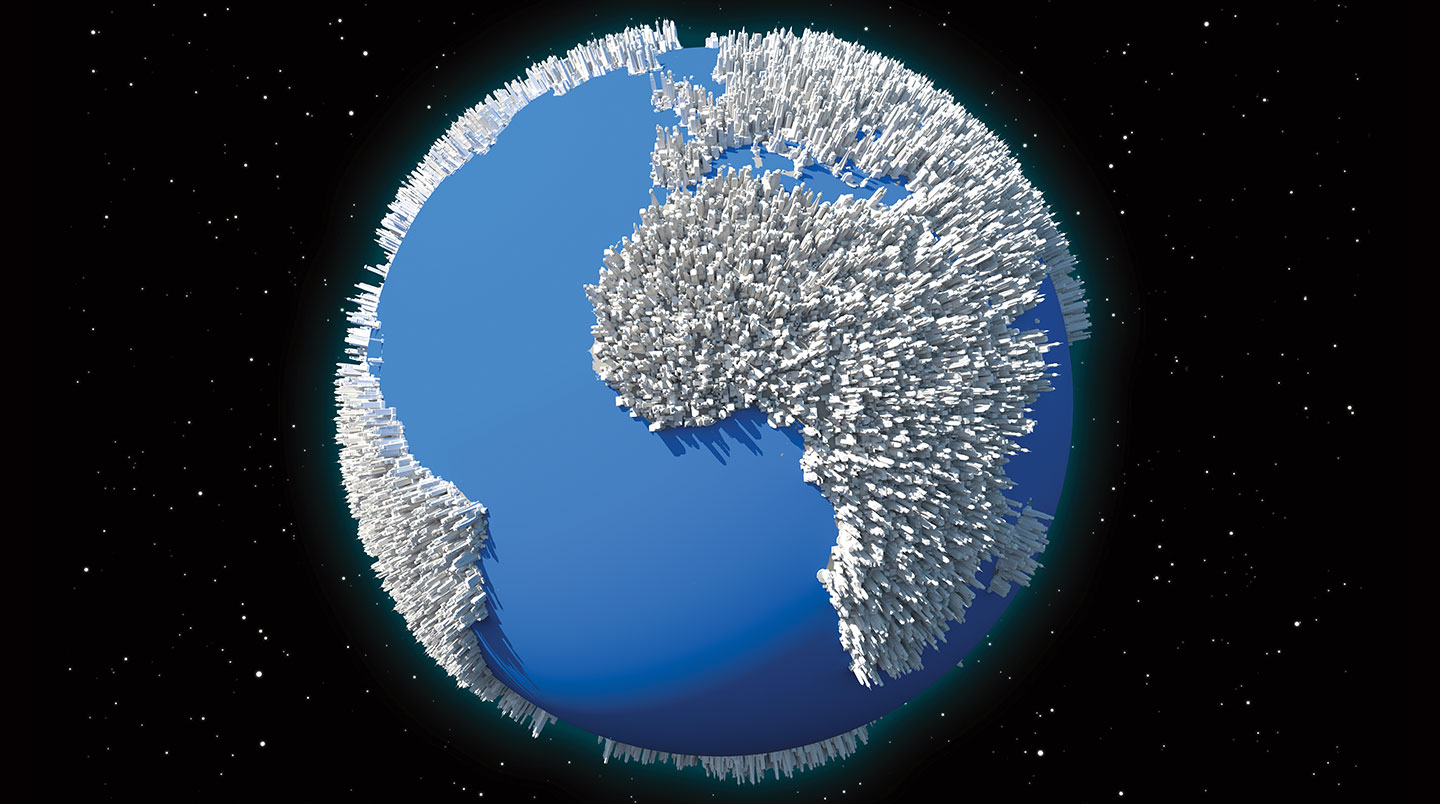
There are 7.8 billion people on Earth right now—more than ever before. In fact, the population is three times the size it was just 70 years ago.

That record growth may be coming to an end, however. United Nations (U.N.) experts say that by the year 2100, the global population will reach 10.9 billion and then stop increasing for the first time in modern history.

These projections are based on two main factors: death and birth rates. The number of deaths that occur globally each year has remained relatively stable in recent decades because of advances in health care, experts say.

But the number of births is another story. In 1950, the average woman had five babies in her lifetime. Today, she has about 2.5 babies. By 2100, demographers say, she will have 1.9—too few to keep the world population growing.

“Couples have gone from having lots of children . . . to a smaller number that they invest a lot more in,” says David Lam, a population expert at the University of Michigan.

Population Shift

Half the world’s population growth over the next 80 years will be in just a handful of countries, U.N. data show. Almost all of them are in Africa, which has a larger percentage of young people than other continents. By 2100, half of all babies will be born there—up from 3 in 10 today, experts say.

The U.S. population is also expected to increase through 2100, because of migration. But 90 nations will experience population decline.

Preparing for the Future

The U.N. projections can help nations plan. For example, in 2100, people ages 65 and up will outnumber kids, the data show. Knowing that, some nations may invest more in services that help the elderly.

Slow population growth can have benefits, Lam says. “It’s easier for the world to produce enough food and enough housing,” he explains. “There’s going to be less pressure on the environment.”

Where People Live Today

This map shows how the population is spread around the globe and highlights the five most populous countries.

Jim McMahon/Mapman®

POPULATION DENSITY is the average number of people per square mile in a particular area. This map uses color coding to show variations in population density worldwide. To figure out an area’s population density, divide its population (number of people) by its area (number of square miles).

Shutterstock.com

MAP SKILLS

1. Red represents how many people per square mile?

2. Which color represents the fewest people per square mile?

3. Which continent on the map averages the fewest people per square mile?

4. Is Asia or North America more densely populated?

5. What is the U.S. population?

6. Is Africa or Europe less densely populated?  

7. What is the world’s most populous nation today?

8. What is its population?

9. India has how many more people than the U.S.?

10. Which of today’s most populous nations are set to be in the top five in 2100?

Skills Sheets (4)
Skills Sheets (4)
Skills Sheets (4)
Skills Sheets (4)
Lesson Plan (3)
Lesson Plan (3)
Lesson Plan (3)
Text-to-Speech